
Turn your Phone to Landscape
![]()
The Frequency Report – built into the Business Control Panel
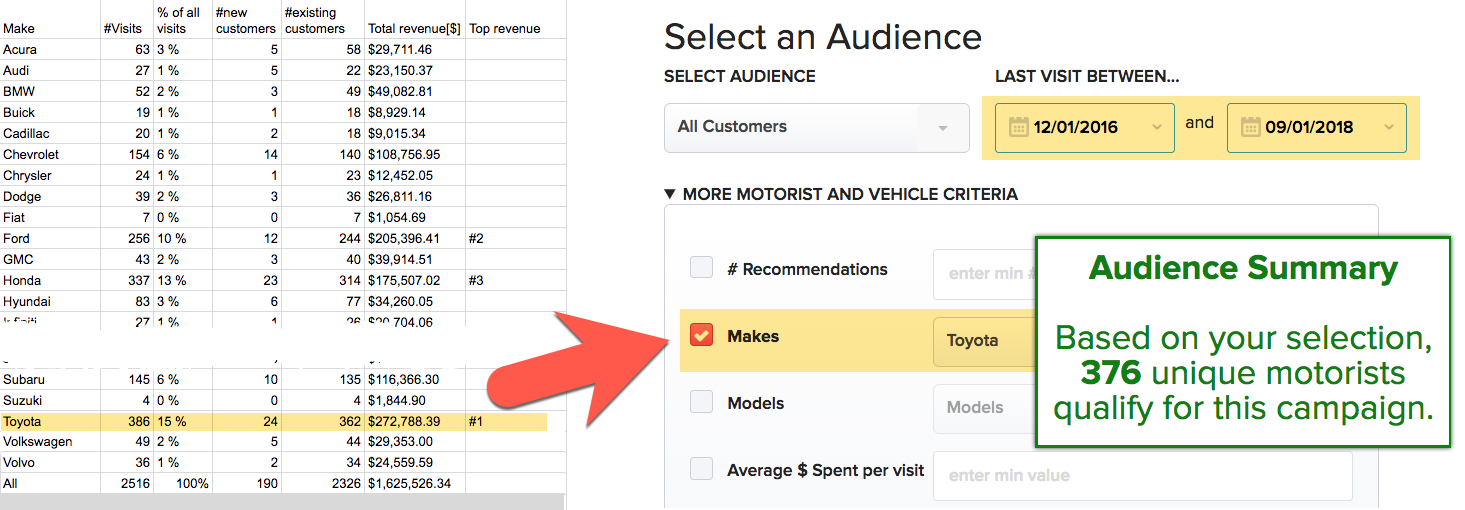
You want to know about return customers and their behavior. Do they skip a visit you recommended? How often do they come back? how much do they spend on average? What is your sweet spot concerning Makes, Year of the vehicle, zip code stats and a lot more? Why are those stats important?
You can tailor your retention campaigns specifically to these sweet spots. Use the campaign manager to configure campaigns and go for the identified sweet spots.
The frequency report is in the business control panel. It can be accessed by clicking on the “Shop Meeting” icon in the menu bar. You are being asked to log in with your registered Gmail or Google for work email address. This email address is the implementer’s email address registered during the intro call with your AutoVitals trainer/advisor

If you don’t have immediate access, please use the help button to request support.
Go to the primary KPI Retention Rate and press the download button:
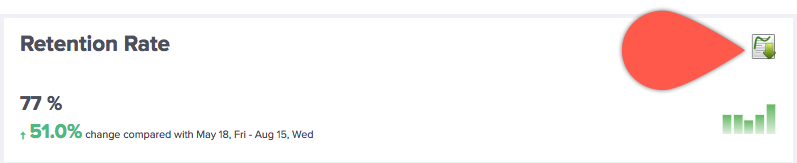
then you will receive a CSV file you can look at in Excel or Google sheets and it has the following sections
the file you downloaded includes the following data sections:
- the list of all customers visiting the shop in the selected time window
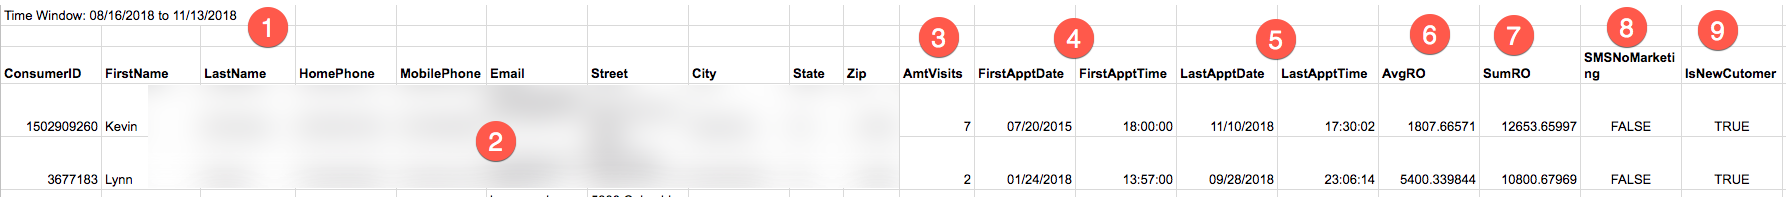
- Time window
- contact data
- Amount of visits
- First appointment date and time
- Last appointment date and time
- ARO
- Aggregate revenue from this customer
- is the customer known to not receive marketing campaigns
- is the customer a first-time customer
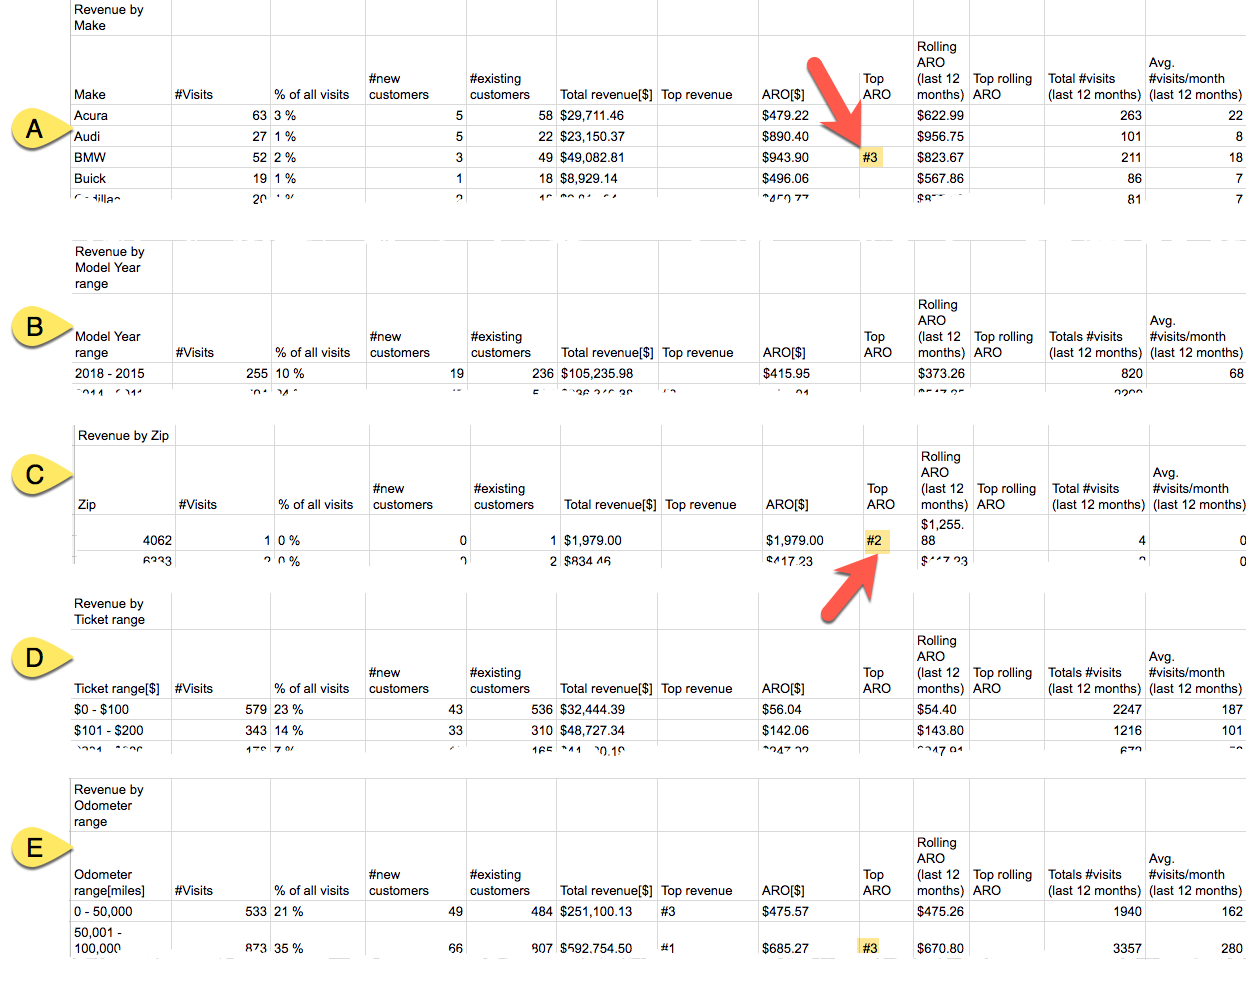
- in addition, the following sections are added all listing revenue grouped by different categories, including highlighting the top 3 scorers in each category (arrow).
- Revenue by Make, Year, Zip code and Odometer Range.
- Revenue by Make, Year, Zip code and Odometer Range.
[powr-comments id=8b07f41a_1542237974]

Didn’t Find what you were looking for?
- Release Notes V6.0.52 (TVP.X) and V5.0.58 (TVP Legacy) - October 23, 2020
- Release Notes V6.0.50 (TVP.X) and V5.0.57 (TVP Legacy) - October 11, 2020
- Release Notes V6.0.47 (TVP.X) and V5.0.56 (TVP Legacy) - September 26, 2020